
Although a near-record 81.5% of eligible Californians were registered to vote as of May 23 — the highest percentage heading into a gubernatorial primary election in 68 years — just 14% of the had returned their ballot as of today, according to a tracker from Political Data Inc.
If this trend continues, California could potentially break its low-turnout record set during the 2014 primary election, when just 25.17% of registered voters cast ballots, according to the Los Angeles Times.
That’s despite the fact that every active registered voter received a mail-in ballot and voters also have had the option to vote early in person.
Ballot return numbers for the city of San José and Santa Clara County – with a number of contested races in newly vacant positions – are running only slightly better than the state as a whole, as of today.
To be counted, primary ballots must be postmarked by midnight or deposited in drop boxes by 8pm Election Day Tuesday.

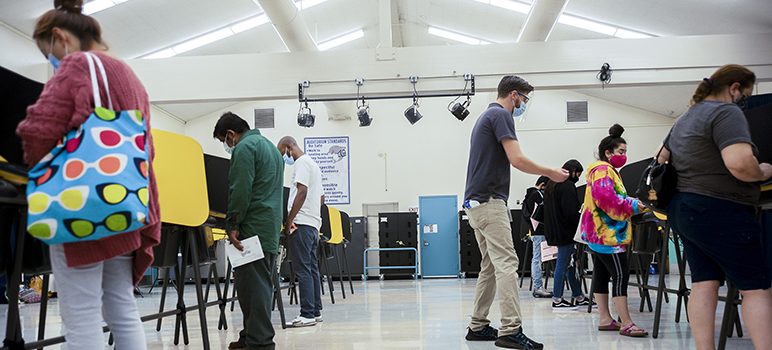
Primary voting in San Jose, as of June 5.
Graphic from Political Data Inc.
In San José, despite a hotly contested mayoral contest, where seven candidates have spent record amounts of money to be elected to the post left vacant by termed-out Mayor Sam Liccardo, just 17 percent of the more than a half-million eligible voters had returned ballots as of today.
Of 518,602 ballots mailed to San José voters, just 86,892 had been returned as of today.
In San José, the turnout percentage varied little among political parties – 18% for Democrats, 19% for Republicans and 13% for independents.
The mayoral and council races have sparked even less interest so far among younger voters.
Just 8% of voters aged 18-34 had returned ballots as of today, while ballots from the biggest voting bloc of 50-64 year olds reached 17%. As for seniors, 34% of voters over 65 in San José had returned ballots as of today, according to Political Data.
The county totals so far aren’t much different than the city’s – slightly better than the state but near record low levels, as of today.
Of 998,073 ballots mailed to all Santa Clara County eligible voters, just 178,283 had been returned as of today.
Countywide, the percentage varied little among political parties – 20% for Democrats and Republicans and 14% for independents. The county supervisor contests and local ballot measures also have sparked little interest so far among younger voters.
Just 9% of voters aged 18-34 across Santa Clara County had returned ballots as of today, while ballots from the biggest voting bloc of 50-64 year olds reached 17%. As for seniors, 35% of voters over 65 in the county had returned ballots as of today, according to Political Data.
Ballots can be deposited in the dropboxes at any time. Click here for a list of ballot drop box locations in Santa Clara County.
Voters also can drop their ballots off at a Vote Center, where they also can vote in person. Voters can visit any location to cast a ballot. While voters are not required to bring Vote-by-Mail ballots to a Vote Center if they prefer to vote in person, it is strongly encouraged by elections officials. Click here for a list of Vote Centers.
Click here to track your mail-in ballot.
Who are candidates
Click here for a list of qualified local candidates.
Click here for a list of legislative and statewide candidates.
Emily Hoeven of CalMatters contributed to this report.