

New data show that California saw a 10 percent jump in homicides from 2014 to 2015, but a 25 percent drop in the past decade.
A report released this month by state Attorney General Kamala Harris tallied 1,861 killings throughout the state—up from 1,697 in 2014 and down from 2,483 in 2006. In other words: 4.8 victims per every 100,000 people.
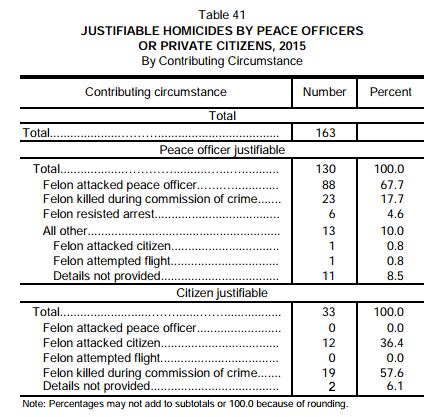
The annals also offer a glimpse of the type of killings, including those committed by and against police. According to the report, available online here, cops killed 130 people in California last year compared to 116 in 2014.
Source: Office of the Attorney General
All of those officer-involved shootings were ruled justifiable, nearly half took place on the street or sidewalk and all but seven of those killed were men. Of those slain by police, 42 percent were Latino, 32 percent white and 18 percent black.
Those figures appear to be a conservative estimate, however, as the Washington Post counted 188 people fatally shot by police in California last year, while the Guardian counted 210.
Meanwhile, the two line-of-duty deaths documented last year took the lives of local police officers. Hayward police Sgt. Scott Lunger and San Jose’s Officer Michael Johnson died in 2015, the latter shot by a suicidal gunman. In the past decade, 36 California cops have been killed on the job.
Of all killings in the state last year, about 83 percent of victims were men. Latino and black victims tended to be younger, under 30, while more than half of white victims were aged 40 and up. The weapon of choice in 70 percent of the killings: guns. Knives accounted for another 14 percent.
There’s a clear gender divide when it comes to domestic violence, which made up 10.5 percent of last year’s killings. Strangers killed 38 percent of male victims compared to 12 percent of their female counterparts.
Most men lost their lives outside the home and only 1 percent to a spouse. Meanwhile, 25 percent of female victims died at the hands of a partner and 52 percent were killed in their own house.
Authorities cited gang-related motives in 29 percent of the killings, while 28 percent erupted from an “unspecified argument” and 7 percent from robberies. Men made up the vast majority—89 percent—of people arrested on suspicion of murder. Some 6 percent were under the age of 18.
Though California suspended executions a decade ago, people are still being sent to death row. Last year, the state saw 14 men sentenced to death and one woman.
The Attorney General’s Office publishes homicide and other crime data on its OpenJustice data portal, which it launched last year in response to public demands for greater transparency.
For some reason, despite the current national focus on race, the story only includes racial statistics with regard to those killed by the police. The author apparently chose not to include any statistics on the racial breakdown of those who were murdered and the suspects in those murders. I have no idea why this would be the case. None at all.
> Of all killings in the state last year, about 83 percent of victims were men. Latino and black victims tended to be younger, under 30, while more than half of white victims were aged 40 and up.
ALWAYS ALWAYS ALWAYS keep in mind that the government — ESPECIALLY a government run by “progressives” — massages and distorts statistics to support their political narrative.
Exhibit A: Crime statistics.
The government classifies people by “race”:
white, non-Hispanic
Hispanic
Black
Asian-Pacific Islander
When a “white” perpetrator victimizes a “Hispanic” person, it’s classified as an “interracial” crime.
When a “Hispanic” perpetrator victimizes a “white” person, it’s classified as “white on white” crime.
Similar story with “unemployment” statistics:
If an unemployed person stops looking for work, they are NO LONGER unemployed. They are “out of the workforce”,
and by dropping out of the workforce, the unemployment rate goes DOWN.
When EVERYONE stops working and stops looking for jobs, the unemployment rate becomes ZERO!
Good job, Obama!
Lies, damn lies, and statistics.
Men made up 89% of murder suspects? Solution we must ban men!
I’m shocked by the numbers….shocked I tell you!