
After a flurry of called races, victories proclaimed and concessions offered across 52 congressional districts, 100 state Assembly and Senate contests, nine statewide races for constitutional offices and seven propositions on the California ballot, it can be hard to wrap your head around what exactly happened.
As of 5pm Nov. 18, there were still 1 million ballots left to tally. That’s all part of a tried, true and prolonged process that often has the rest of the nation waiting for weeks on California’s vote totals.
But some clear trends are beginning to emerge. Here are a few of them.
Fight to a standstill
In Congress, after months of campaigning and more than $340 million spent, it appears that California Democrats and Republicans fought themselves to a standstill, with neither side unseating any of the opposing party’s vulnerable incumbents. That includes Orange County’s Katie Porter and San Diego’s Mike Levin on the Democratic side, as well as Southern California Republicans Mike Garcia, Michelle Steel, Young Kim and Ken Calvert. All will be returning to Congress.
All of that adds up to a big, monumentally expensive near wash. Republicans currently have 11 U.S. House seats in California. After this election, they’re on track to have 12, though the Modesto contest between Democratic Assemblymember Adam Gray and Republican farmer John Duarte is still too close to call.
Another undecided nailbiter: The race in Bakersfield between GOP Rep. David Valadao and Democratic Assemblymember Rudy Salas.
Democrats are in line to be down at least one seat — from 42 to 41 — but that’s because the state was docked a congressional seat after the most recent Census.
The David Valadao Club
One reason why incumbent Republican Garcia was considered to be especially vulnerable this year is because his congressional district, which encompasses the northeast suburban corner of Los Angeles County, is mostly Democratic, at least by registration.
Based on the most recent numbers, registered Democrats in the district outnumber registered Republicans by almost 13 percentage points.
And yet, Garcia was reelected this year. In fact, the Associated Press called the race on Wednesday, making it the 218th Republican seat and the one that secured the GOP majority in the U.S. House.
That places Garcia in what might be called the “David Valadao Club of Republicans.” Valadao has long represented the south Central Valley, despite his district’s overwhelmingly Democratic registration. Valadao’s race has yet to be called, but Steel in Orange County and Calvert in Riverside County also joined the club this election.
At last count, there are as many as a dozen Republican congressional and legislative candidates across the state who were elected — or are on track to being elected — in districts where Democrats outnumber Republicans.
So far, there’s only one example of the opposite — a Democrat likely to represent a Republican district. Marie Alvarado-Gil, a charter school administrator and self-described centrist, is ahead of fellow Democrat Tim Robertson in a state Senate district spread across the rural central Sierra where Republicans exceed registered Democrats by roughly 3 percentage points. That’s largely the result of an electoral fluke in the June primary, thanks to the state’s “top two” election system.
This is all more than just political trivia. These outliers are most likely to flex their bipartisan muscles and skew centrist in an effort to appeal to their purple electorates — though Garcia himself has been a bit of an exception to that rule.
And for any luckless readers who are already obsessing about the next general election in 2024, these outliers are likely to be top electoral targets.
Democrats still dominate California
There wasn’t much of a partisan change in the Legislature. Though a handful of races are still too close to call, Democrats will continue to hold roughly 3 out of 4 seats in both the Senate and the Assembly — enough to keep super-majorities that give them immense power over spending and legislation.
But just because the party division is set to stay basically the same doesn’t mean there aren’t changes afoot in Sacramento. The Legislature saw a surge in retirements and early exits this election cycle. The freshman class is likely to have a record number of women and LGBTQ members.
From red Lassen to blue San Francisco:
How counties voted for statewide officers
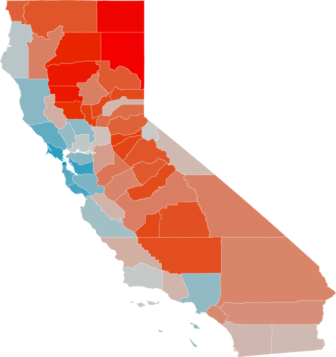 As goes Alpine, so goes California
At least, that seemed to be the case this midterm election. Though California is often thought of as a solidly blue bulwark, it’s actually a patchwork of cobalt, blood crimson and purple.
See the map, based on Secretary of State results as of Nov. 17, 2022. Blue counties are Democrat, red counties are Republican, with shades in between. A Flourish map
On one end of the spectrum sits Lassen County in rural northeast California. There, the Republican candidates for governor, lieutenant governor, treasurer, secretary of state, attorney general, controller, superintendent of public instruction and U.S. senator are beating their Democratic opponents by an average of 56 percentage points. That’s compared to the statewide average, where voters across California are picking Democrats by a roughly 19-point margin. That means Lassen’s electorate leaned about 75 percentage points more Republican than the state as a whole.
Lassen’s bluest counterpart is, perhaps not surprisingly, San Francisco, where the electorate favored the Democrats by 47 percentage points more than the average California voter.
And the county that most closely reflected the California average, with only the slightest 0.34% periwinkle blue hue: The roughly 1,000 registered voters of Alpine County.
A note about these kinds of maps: Counties don’t vote, people do. So though this color-coded version of California may look overwhelmingly Republican, the blue bits are where the vast majority of the state’s voters live.
Most expensive loser
DraftKings, FanDuel and other supporters of Proposition 27, a measure that would have legalized online sports gambling in California, poured $169 million into the campaign.
It didn’t work. At last count, the measure won over just 17% of California voters.
Combine near record-breaking spending with a near record-breaking blowout and you get one of the worst returns on political investment in California history. For every 1% of the electorate’s support, the Yes on 27 campaign spent nearly $10 million.
That’s 50 times more than the backers of Prop. 28 spent. That measure, which will require the state to spend more on arts and music education, had the advantage of being so popular that nobody bothered to file an official ballot argument against it. That allowed backers to spend just $11 million — couch cushion change for a California ballot measure — to win nearly two-thirds of the vote.
Success shouldn’t only be measured in terms of passage and failure.
Prop. 29, the third attempt at the ballot box to regulate dialysis clinics that California voters have faced since 2018, went down to another predictable defeat. But the Service Employees International Union-United Healthcare Workers, which has sponsored each of these measures, got this year’s decisive defeat for a relative steal. The campaign spent a little more than $8 million in an effort that opponents characterize as a hardball tactic against dialysis clinic chains DaVita and Fresenius, whose workers the union hopes to organize.
To defeat the measure, those two companies spent more than $80 million.
Most popular proposition
Propositions don’t have “D” or “R” labels next to them on the ballot. But in a polarized California, liberal and conservative parts of the state favored very different measures.
Prop. 1, which enshrined the right to an abortion in the California constitution, was the most popular measure statewide, winning two-thirds of the vote. But that support was mostly concentrated on the Democratic coasts, where it received a higher share of the vote in those counties than any other measure on the ballot.
That may provide some evidence that the measure worked as intended: Democratic lawmakers put it on the ballot, at least in part, to turn out Democrats and other liberal-leaning voters. Indeed, the places where Prop. 1 fared the best were, almost county-by-county, the same places where Gov. Gavin Newsom, who campaigned for it, most handily beat his Republican opponent, GOP Sen. Brian Dahle, who opposed the measure. (In statistics-speak, the shares of each county’s vote that went to Newsom and to Prop. 1 have a nearly perfect positive correlation).
In more moderate to conservative parts of the state, the two ballot measures that won the most support were Prop. 28, which directs more state funding to arts education, and Prop. 31, which upholds a statewide ban on flavored tobacco.
Ben Christopher is a reporter with CalMatters.
Just an observation,
Until the GOP actually provides any good policies to encourage people to vote for hem, this situation is not going to change.
The PPIC reports that there are Among registered voters, 46.8% are Democrats, 23.9% are Republican, and 22.7% say they are independent (also known as “decline to state” or “no party preference”
That means if the GOP wants to actually gain ground, they have to stop demonizing Democrats and Independents. The simple fact that the GOP has a 23.9% versus the rest being 76.1%.
The current attitude of GOP and others to actually insult voters is NEVER going to work, unless somehow you BLOCK all other votes from being counted.
The VOTERS are in power in CA, not PARTIES